
In my previous analysis, I introduced a conservative swing trading strategy using the 5 EMA / 218 SMA crossover. The premise was simple: use the 218-day Simple Moving Average as a “Bull/Bear Line” to filter out noise and avoid catastrophic drawdowns like 2022.
It works. It keeps you safe. But I must admit, it has one fatal flaw.
It is too slow.
The Reality Check: Safety vs. Speed
The 218 SMA acts like a massive aircraft carrier—it takes a long time to turn. If the market experiences a V-shaped recovery (which is common in the Nasdaq), the standard “Golden Cross” signal triggers way too late. By the time the 5 EMA crosses above the 218 SMA, TQQQ might have already rallied 30-40% from the bottom.
While you avoided the loss, you also missed the most explosive part of the recovery. To fix this, I have upgraded the algorithm to v48.0.
The Solution: A Hybrid Logic (Trend + Mean Reversion)
I realized that I cannot rely solely on “Trend Following.” I need to incorporate “Mean Reversion” (Dip Buying) logic to capture extreme fear.
The updated strategy now operates on two distinct gears:
1. Gear 1: The Shield (Trend Mode)
- Logic: Standard 218 SMA rule.
- Action: If Price > 218 SMA, we hold TQQQ. If it breaks, we sit in Cash. This protects us from prolonged bear markets.
2. Gear 2: The Sword (Panic Mode) – NEW
- Logic: Even if the trend is bearish (Price < 218 SMA), we look for oversold signals in the underlying asset (QQQ).
- Trigger A: If QQQ drops -15% from its All-Time High → Deploy 40% Cash.
- Trigger B: If QQQ drops -25% from its All-Time High → Deploy 50% Cash.
By using QQQ’s drawdown (instead of TQQQ’s volatile decay) as the trigger, we can mechanically “buy the fear” while the rest of the market is panic selling.
New Feature: The “Pro” Dashboard
A strategy is useless if you cannot execute it properly. I wanted to see my risk and status at a glance, so I coded a Real-time Dashboard directly onto the TradingView chart.
(Insert Screenshot of the Dashboard here)
- Real-Time P&L: You can input your actual Average Price and Quantity in the settings. The script calculates your real P&L ($/%) live on the chart.
- Visual Status: The candle colors change automatically to tell you the current stage:
- Gray: Cash (Wait)
- Blue: Dip Buying (Accumulate)
- Green: Full Bull Market (Trend Hold)
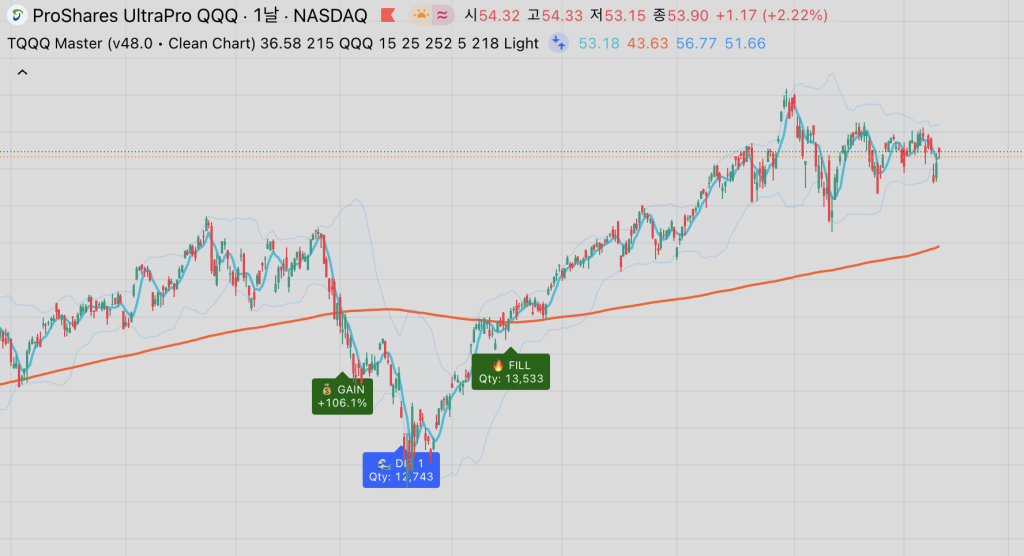
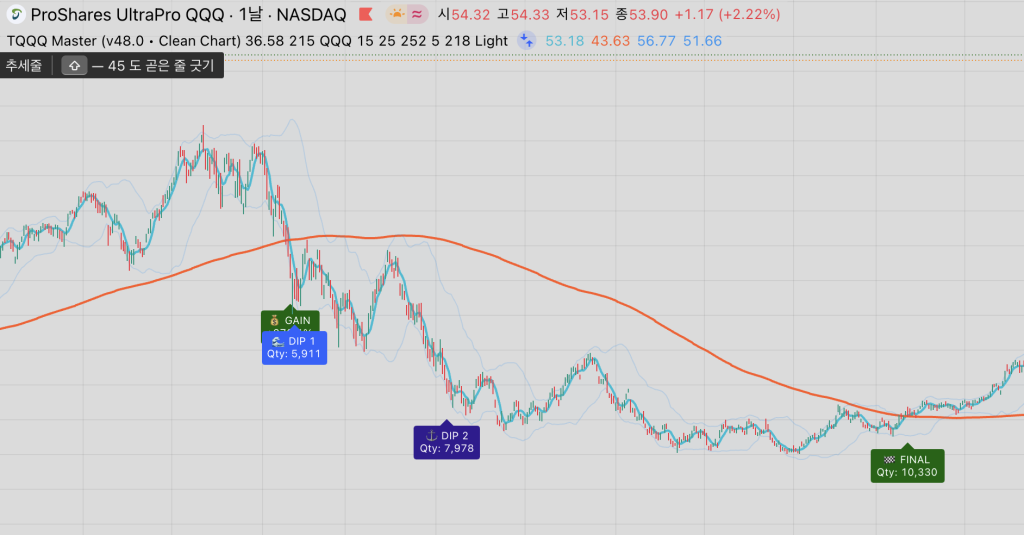
Some preview screenshots of the strategy.